(Solution) CIPD 5C002 Task two – quantitative and qualitative analysis review
Solution
| Turnover and recruitment take up for Technivara 2024 | ||||||||
| Total in Department 2024 | Leavers for 2024 | Leavers as a % against total in each Department | Positions vacant | Vacancies as a % against total in each Department | Positions filled | Positions filled as a % of total in each Department | ||
| Audio technical Department | 26 | 6 | 23.08% | 8 | 30.77% | 3 | 11.54% | |
| Offices and Administration | 15 | 4 | 26.67% | 5 | 33.33% | 5 | 33.33% | |
| Research and Development | 8 | 1 | 12.50% | 4 | 50.00% | 4 | 50.00% | |
| Quality control | 4 | 2 | 50.00% | 3 | 75.00% | 3 | 75.00% | |
| Dispatch | 15 | 4 | 26.67% | 6 | 40.00% | 6 | 40.00% | |
| Engineering | 35 | 8 | 22.86% | 8 | 22.86% | 3 | 8.57% | |
| Casting Department | 6 | 3 | 50.00% | 5 | 83.33% | 2 | 33.33% | |
| Sales & Marketing | 12 | 4 | 33.33% | 3 | 25.00% | 3 | 25.00% | |
| Human Resources | 4 | 1 | 25.00% | 1 | 25.00% | 1 | 25.00% | |
| Design | 12 | 3 | 25.00% | 5 | 41.67% | 2 | 16.67% | |
This table presents the Technivara’s turnover and recruitment data for 2024 by department. It highlights three important percentages: the number of employees who left (leavers) as a percentage of total staff which is 26.28%, the number of vacant positions as a percentage of total staff which is 35.04%, and the number of new hires (positions filled) as a percentage of total staff which is 23.36%. Understanding these percentages helps us determine which departments are losing more employees, how many job vacancies are open, and how well is the company recruiting to fill those job positions.
Looking at the table, the data shows that some departments have exceptionally high turnover rates. in particular, the Quality Control and Casting departments each lost 50% of employees during the year. In addition to losing a significant proportion of their workforce, these departments also face very high vacancy levels, with 75% of positions in Quality Control and 83.33% in Casting remaining unfilled. Despite these openings, recruitment activity has been limited, with only 75% of Quality Control and 33.33% of Casting positions filled relative to each department’s total size.
This pattern is reflected more broadly across other Technivara departments, where most departments have a higher percentage of vacancies than filled positions. For example, the Audio Technical department has a turnover rate of 23.08%, vacancies at 30.77% vacancies, while only 11.54% of the job positions filled. This assessment indicates that recruitment efforts are not keeping up with employee departures, which is likely creating pressure on existing reams and disrupting operational productivity and efficiency.
In contrast, other departments, such as Sales & Marketing, recorded lower turnover rate equivalent to 33.33% and lower vacancies at 25%, and experienced full recruitment as the 25% of positions are filled. Similarly, the Offices and Administration department reported a turnover rate of 26.67%, with 33.33% of roles vacant and an equal percentage of positions filled, suggesting balanced recruitment in those respective departments. Furthermore, the Research & Development department had the experienced the lowest turnover at 12.5%, with 50% vacancies and 50% positions filled, suggesting they are performing better at retaining staff and hiring new employees.
In summary, Technivara faces significant challenges in departments like Quality Control and Casting, where half the workforce has left and vacancy levels remain very high. Recruitment efforts continue to be struggling in filling these job roles, resulting in evident understaffing and operational strain. Other departments demonstrate moderate turnover with a more balanced rate of hiring. Hence, addressing the underlying reasons for employee departures and improving recruitment processes will be essential to stabilize the workforce and enhance overall productivity.
Q9. When you have completed Table 1, present your findings using a minimum of three different types of diagrammatical forms. (AC 2.2) 266
You don’t need to provide a reference or in-text citation for AC 2.2
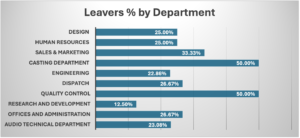
The first diagram is a bar chart illustrating
Please click the following icon to access this assessment in full
Related to:https://rankedprofessionals.com/downloads/solution-cipd-5c002-task-one-questions/