(Solution) 5C002 Q8-AC2.1 Table 1 shows Technivara’s turnover and recruitment data for 2024
Solution
Sue has asked you to convert the data into percentage form, for each of the departments, to show:
| Department | Total in Department 2024 | Leavers for 2024 | Leavers as % against total in each Department
(Leavers for 2024/Total In department 2024) x100 |
Positions vacant | Vacancies as a % against total in each Department
(Position Vacant/Total In department 2024) x100 |
Positions filled | Positions filled as a % of total in each Department
(Position filled/Total In department 2024) x100 |
| Audio technical Department | 26 | 6 | 23.1 | 8 | 30.8 | 3 | 11.5 |
| Offices and Administration | 15 | 4 | 26.7 | 5 | 33.3 | 5 | 33.3 |
| Research and Development | 8 | 1 | 12.5 | 4 | 50 | 4 | 50 |
| Quality control | 4 | 2 | 50 | 3 | 75 | 3 | 75 |
| Dispatch | 15 | 4 | 26.7 | 6 | 40 | 6 | 40 |
| Engineering | 35 | 8 | 22.9 | 8 | 22.9 | 3 | 8.6 |
| Casting Department | 6 | 3 | 50 | 5 | 83.3 | 2 | 33.3 |
| Sales & Marketing | 12 | 4 | 33.3 | 3 | 25 | 3 | 25 |
| Human Resources | 4 | 1 | 25 | 1 | 25 | 1 | 25 |
| Design | 12 | 3 | 25 | 5 | 41.7 | 2 | 16.7 |
Q9-AC2.2. When you have completed Table 1, present your findings using a minimum of three different types of diagrammatical forms
- 3-D Column
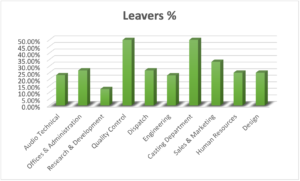
The 3-D graph highlights turnover across departments. The highest proportion of leavers is in Quality Control and Casting of 50 indicating severe retention issues. Sales & Marketing is also characterized by high turnover (33.3%), which may be either job discontent or rivalry in the industry. Conversely, the Research and Development has the lowest turnover (12.5%), which means a greater stability of employees and, possibly, greater engagement. Engineering is the largest department but exhibits the average turnover of 22.9, which could be understood because of its size. This trend shows that the smaller departments such as Quality Control and Casting are at the greatest risk of high turnover percentages as only a few exits cause a significant difference in the workforce in relation to that department. Quality control, casting and sales are some of the key areas where retention should focus in order to mitigate instability.
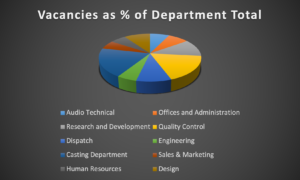
- Pie Chart
Please click the following icon to access this assessment in full