Solution
(Solution)Trends in GHG emissions in the United Kingdom
Executive Summary
This report evaluates the feasibility of replicating Carbon Capture and Storage (CCS) initiatives, such as the Aramis project, within the UK to support its legally binding commitment to achieving Net Zero greenhouse gas (GHG) emissions by 2050. The analysis aligns with both UK policy goals and broader European sustainability strategies under the European Green Deal.
Using historical emissions data from 2013 to 2022 and linear forecasting methods, the report identifies a sustained decline in UK GHG emissions, from approximately 566 MtCO₂e in 2013 to 406 MtCO₂e in 2022, marking a 28% reduction. Significant progress has been made in the energy supply sector due to the shift from coal to renewable energy sources. However, sectors such as transport, agriculture, and industry have shown limited progress, highlighting the need for additional measures to maintain momentum.
Forecasts suggest that while emissions will continue to decline through 2026, the rate of reduction is slowing. To bridge the remaining gap toward Net Zero, the deployment of CCS technologies is identified as a strategic and operational necessity, especially in sectors where decarbonisation remains technically or economically challenging.
A correlation analysis further supports this approach, revealing strong positive relationships between total emissions and sectors like industry, waste, and fuel supply. These findings underscore the potential impact of CCS in reducing residual emissions in high-contributing areas.
Based on these insights, the report recommends:
- Expanding CCS infrastructure in emission-intensive sectors such as industry, transport, and energy production.
- Engaging private and international stakeholders to attract investment and share expertise.
- Integrating CCS as a central component of the UK’s diversified decarbonisation strategy.
- Developing operational systems for CO₂ capture, transport, storage, and monitoring.
- Implementing supportive financial and regulatory frameworks to accelerate CCS deployment
Table of Contents
2.0 Trends in GHG emissions in the United Kingdom over the past 10 years. 3
3.0 The expected emission trend for the next four years. 7
3.1 Linear Trend Forecasting Method. 7
4.0 Inferential data analytical method. 8
4.2 Recommendations to the UK government 10
5.0 Implications from operations and sustainability perspectives. 10
Figure 4: The expected emission trend for the next four years (2023-2026) 8
1.0 Introduction
The United Kingdom, like many industrialised nations, faces significant challenges in achieving its legally binding target of Net Zero greenhouse gas (GHG) emissions by 2050. While notable progress has been made in sectors such as energy generation, other areas including transport, manufacturing, and agriculture continue to produce substantial emissions, threatening to slow the pace of national decarbonization (Poynting, 2024). To address these challenges, the government must identify and implement complementary technologies and strategies capable of reducing residual emissions and supporting sectors where direct decarbonisation remains complex and costly.
One promising solution is Carbon Capture and Storage (CCS), a technology designed to capture carbon dioxide (CO₂) emissions from industrial processes and energy production before transporting and securely storing them underground (Dudun & Inuwa, 2025). Internationally, large-scale CCS projects like the Aramis project in the Netherlands have demonstrated operational feasibility and potential environmental benefits. This report evaluates whether similar CCS projects should be replicated within the UK context.
By analysing historical GHG emissions data from 2013 to 2022, applying forecasting methods for future trends, and using inferential data analysis, this report presents evidence-based insights to inform operational decision-making. The findings aim to support government policy formulation, promote sustainable industrial practices, and strengthen the UK’s long-term climate strategy while addressing operational and project delivery challenges.
2.0 Trends in GHG emissions in the United Kingdom over the past 10 years
To assess the viability of replicating CCS projects in the United Kingdom, an analysis of historic greenhouse gas (GHG) emissions trends from 2013 to 2022 was undertaken. Data covering total national emissions and sector-specific contributions was examined, using line graphs and percentage change calculations to visualize changes over time as follows;
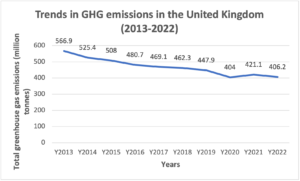
Figure 1: A Line Graph Representing the Trends in GHG emissions in the United Kingdom over the past 10 years
The graph in figure 1 reveals a consistent decline in total UK GHG emissions, decreasing from approximately 566 million tonnes of carbon dioxide equivalent (MtCO₂e) in 2013 to around 406 MtCO₂e in 2022. This represents a 28% reduction over the decade, reflecting the UK’s gradual but determined progress towards decarbonisation.
In addition, to assess the feasibility of replicating CCS projects in the UK, further analysis involves segmenting historic GHG emissions data by key Territorial Emissions Statistics (TES) sectors. The data reveals a consistent overall decline in UK emissions over the decade, although with varying rates of progress across sectors as shown in Figure 2 below;
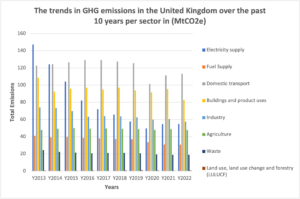
Figure 2: The trends in GHG emissions in the United Kingdom over the past 10 years per sector in (MtCO2e)
From this analysis, it is evident that the electricity supply sector achieved the most significant reduction, falling from 147.3 MtCO₂e in 2013 to 54.9 MtCO₂e in 2022, a 62.7% decrease. According to Chakaodza (2024), this reflects the rapid decarbonisation of the UK power system, driven by the closure of coal-fired power stations and increased reliance on renewables such as wind and solar. A line graph illustrating this trend would show a steep, continuous decline throughout the period as shown in Figure 3;
Figure 3: A line graph illustrating continuous decline in GHG emissions in electricity supply sector
Conversely, domestic transport emissions saw only a 7.9% reduction, from 122.8 MtCO₂e in 2013 to 113.2 MtCO₂e in 2022. Despite a temporary drop during the 2020 pandemic (down to 101.3 MtCO₂e), emissions rebounded by 2021-2022, indicating persistent challenges in decarbonising road transport despite growing electric vehicle adoption (Anderson, 2025).
In addition, industrial emissions declined from 74.1 MtCO₂e to 57.4 MtCO₂e, a 22.5% decrease, while fuel supply emissions fell by 24.9% over the same period. Buildings and product uses experienced an overall 23.7% reduction, although figures fluctuated due to variations in heating demand.
In contrast, agriculture emissions remained relatively stable, decreasing marginally from 47.9 MtCO₂e to 47.7 MtCO₂e. Waste sector emissions decreased by 23.3%, while Land Use, Land Use Change and Forestry (LULUCF) data fluctuated, ending at 0.8 MtCO₂e in 2022.
In summary, these sectoral trends are vital for operational planning and strategic decision-making. The uneven progress highlights that while sectors like electricity have effectively decarbonised through renewables, others remain emission-intensive and face operational constraints (Tiseo, 2025). This context justifies the exploration of CCS, targeting hard-to-abate sectors such as industry, transport, and agriculture. Replicating projects like Aramis would enable the UK to capture residual emissions where direct reductions are currently impractical, ensuring a balanced and realistic operational pathway towards the legally binding Net Zero 2050 target.
3.0 The expected emission trend for the next four years
3.1 Linear Trend Forecasting Method
A linear trend forecasting model estimates future values by fitting a straight line (using the least squares method) through the historical data points, then extending this line to predict future values (Zaiontz, 2023).
The formula is:
Y=a + bX
Where:
Y is the forecasted emission
X is the year number (e.g. 1 for 2013, 2 for 2014, 3 for 2015…….10 for 2022)
a is the intercept
b is the slope of the trend line
This is the data to use:
To calculate a and b in our formula, we will use the following functions in excel:
Assuming we arrange our data as below;
Slope b= SLOPE (Y _ range, X_ range),
For example,
=SLOPE (B2:B11, A2:A11)
(Assuming B2:B11 has emissions data, and A2:A11 has X values 1-10)
After doing this, our b is –16.9794
Intercept (a) =INTERCEPT (Y _range, X _range). This gives us 562.5467
Now, our formula is completed as: Y=562.5467 + (-16.9794) X, which lets us predict future values by substituting future time periods for X
We assigned year 2013-2022 values 1-10, so to forecast for year 2023-2026 (four years), we will assign them values 11-14, putting them in the equation we get;
Y2023- Y=562.5467 + (-16.9794) 11= 375.8
Y2024- Y=562.5467 + (-16.9794) 12=358.8
Y2025- Y=562.5467 + (-16.9794) 13=342.2
Y2026- Y=562.5467 + (-16.9794) 14=324.8
This can be represented in a line graph as below;
Figure 4: The expected emission trend for the next four years (2023-2026)
The linear trend forecasting and figure 4 shows that total UK greenhouse gas (GHG) emissions are expected to continue falling year-on-year, from 375.8 MtCO₂e in 2023 to 324.8 MtCO₂e in 2026. This confirms the positive impact of current measures but underlines the operational need for supplementary solutions like CCS. It strategically validates the UK government considering Aramis CCS replications.
4.0 Inferential data analytical method
Here, an appropriate inferential data analytical method would be a correlation analysis to explore the relationship between sector-specific emissions and the overall national emissions reduction trend. This will help identify which sectors most influence total GHG emissions, and therefore where CCS would have the greatest strategic impact if deployed.
4.1 Correlation Method
This method will help determine which sectors have the strongest relationship with total GHG emissions trends in the UK, and guide recommendations on CCS project replications (Hassan, 2024). We will calculate the Pearson correlation coefficient (r) between total emissions and sector emissions from 2013 to 2022. If a sector’s emissions strongly correlate with total emissions, reducing emissions in that sector would have a proportionally larger effect on overall GHG figures, making it a prime candidate for CCS intervention (McLeod, 2023).
The first step is to arrange our data in excel as shown below;
We will then use the CORREL () function in excel: =CORREL (range _ total _ emissions, range _ sector _emissions)
For example, to calculate the correlation between Total Emissions (B2:B11) and Electricity Supply Emissions (C2:C11), we will have =CORREL (B2:B11, C2:C11). Our values will be interpreted as follows:
+1= perfect positive relationship (both rise and fall together)
0=no relationship
–1= perfect negative relationship (one rises as the other falls)
In our case,
Electricity Supply has r= -0.0422761
Fuel Supply has r= 0.89589771
Domestic transport has r= 0.621570134
Buildings and product uses has r= 0.73187156
Industry has r= 0.963037125
Agriculture has r=0.32712216
Waste has r= 0.95082478
Land use, land use change and forestry (LULUCF) has r= -0.40453
From this analysis, it is evident that strong positive correlations exist between total greenhouse gas emissions and sectors like Industry (r = 0.96), Waste (r = 0.95), Fuel Supply (r = 0.90), and Buildings and Product Uses (r = 0.73). These figures suggest that emissions trends in these sectors closely reflect national totals, indicating that effective interventions here could significantly influence overall emissions reductions (Joshi, 2022). In contrast, sectors like Electricity Supply (r = -0.04) and LULUCF (r = -0.40) exhibit weak or negative relationships, reflecting decoupling due to successful decarbonisation and structural limitations, respectively.
4.2 Recommendations to the UK government
Please click the following icon to access this assessment in full
Related to: https://rankedprofessionals.com/downloads/solution-mba-mgt506-human-resource-management-2/