(Solution) Financial Decision Making FINM036 Individual Written Report
Solution
Table of Contents
Section A: Financial Performance. 2
Return on Capital Employed (ROCE) and Return on Equity (ROE) 4
Section B: Corporate Governance Compliance. 11
Proposed Medium Term Financial Strategies. 11
Appendix 1: Epwin Group Employees (2020-2024) 17
Appendix 2: Epwin Group Income Statement 19
Apendix 3: A summary of Epein, Eurocell and Norcos Investment ratios. 20
Appendix 4: Epwin Group PLC Asset Turnover Benchmarks. 21
Figure 1: Net Profit Margin Comparison (Epwin vs Eurocell vs Norcros) 4
Figure 2: ROCE Comparison 2020-2024. 5
Figure 3: ROE Comparison (2020-2024) 6
Figure 4: Asset Turnover Comparison. 7
Figure 5: Inventory Turnover Comparison. 7
Figure 6: Receivables Turnover Comparison. 8
Figure 7: Current Ratios Comparison. 9
Figure 8: Quick Ratios Comparison. 10
Introduction
Epwin Group PLC, founded in 1976 and headquartered in Telford, United Kingdom, is a leading manufacturer of low-maintenance building products for the repair, maintenance, and improvement (RMI) market as well as the new build housing sector. Operating through its Extrusion and Moulding and Fabrication and Distribution divisions, the company’s product portfolio includes PVC-U windows and doors, composite doors, fascias, cladding, rainwater systems, decking, and glass-reinforced plastic components (Epwin Group, 2025). Epwin supplies both the residential and commercial markets, with its products recognised for durability, energy efficiency, and compliance with increasingly stringent environmental standards.
For the financial year ended 31 December 2024, Epwin reported group revenue of £324.0 million and employed 2,173 staff across its UK operations, an increase from 2020 where the company had 2,030 employees as shown in Appendix 1 (Epwin Group PLC, 2025). The business has consistently delivered resilient performance, supported by long-term structural drivers such as housing demand, sustainability requirements, and government incentives for energy-efficient retrofitting.
The UK construction and materials sector contributes approximately £130 billion annually to the national economy, representing around 6% of GDP and employing over 2.3 million people (Bremner & Crowley, 2024). Within this context, Epwin has positioned itself as a major AIM-listed player with ambitions to scale further. This report will critically assess the company’s financial performance, governance, and medium-term strategies as it seeks to position itself for entry into the FTSE 100.
Section A: Financial Performance
To review the last five years of Epwin Group PLC’s performance, a range of financial and non-financial ratios are assessed, with detailed income statements and ratio calculations presented in the appendices. The analysis evaluates profitability, efficiency, liquidity, and investment to provide a balanced view of both short-term stability and long-term growth potential. Benchmarking is undertaken against Eurocell PLC and Norcros PLC, two UK-listed companies operating in the same building products sector, which allows for meaningful comparisons of strengths and weaknesses within the industry. The review draws on data from annual reports between 2020 and 2024, supported by International Financial Reporting Standards (IFRS) figures. This structured approach helps to identify performance drivers, highlight areas of risk, and demonstrate how Epwin is positioned relative to competitors.
Profit Ratios
Looking at the profitability ratios of Epwin, 2024 shows a marked improvement with a net profit margin of 5.1%, up from 2.7% in 2023 (Yahoo! Finance, 2025). This improvement came despite revenue falling to £324.0m in 2024, down from £345.4m in 2023 (London Stock Exchange, 2025). Operating profit increased to £28.5m, giving an operating margin of 8.8%, compared to 6.0% in 2023, reflecting stronger cost control and operational efficiencies across its divisions.
Over the five-year period, Epwin’s margins have fluctuated in line with construction sector pressures. In 2020, the net profit margin stood at just 1.1%, improving to 3.8% in 2021 as demand rebounded post-pandemic, before softening to 2.4% in 2022 amid rising input costs (See Appendix 2). The recovery in 2024 demonstrates resilience and improved capital deployment.
Return on Capital Employed (ROCE) rose to 14.9% in 2024, compared to 9.4% in 2023, highlighting more efficient use of long-term capital. Similarly, Return on Equity (ROE) improved to 16.0% in 2024, from 9.1% in 2023, underlining increased shareholder value creation. These improvements suggest management has been effective in controlling costs, managing working capital, and maintaining discipline in investment decisions.
Benchmarking against peers highlights both opportunities and challenges. Eurocell reported a negative net profit margin of -0.9% in 2020, then recovered strongly to 6.2% in 2021, before declining steadily to 2.6% in 2023 as rising costs outpaced revenue growth (Strike.Market, 2025). Norcros, by contrast, has delivered consistently higher margins, from 3.2% in 2020 to 6.8% in 2023, supported by its diversified product base and strong UK and Ireland operations (Investing.com, 2025). The stability of Norcros compared to the volatility of Eurocell and Epwin illustrates the benefits of diversification and scale.
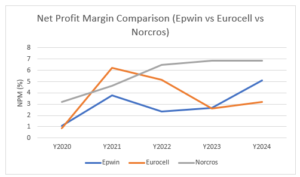
Figure 1: Net Profit Margin Comparison (Epwin vs Eurocell vs Norcros)
Source: Investing.com (2025)
The data shows that Epwin is improving its ability to convert revenue into profit, with its 2024 margin now close to Eurocell’s historic highs and narrowing the gap with Norcros. The sharp rebound in 2024 also signals that operational restructuring and tighter cost control are yielding results. For the board, this suggests Epwin is on the right path toward financial resilience but must continue focusing on margin growth to match or exceed sector leaders. If sustained, these improvements strengthen the company’s credibility in pursuing FTSE 100 status, where profitability and return on capital are critical for investor confidence.
Return on Capital Employed (ROCE) and Return on Equity (ROE)
Return on Capital Employed (ROCE) measures how effectively a company uses its capital base to generate operating profit (Hayes, 2024). For Epwin, ROCE improved significantly over the four-year review period. In 2021, ROCE was around 12.0%, supported by strong post-pandemic recovery in demand. It eased slightly to 10.7% in 2022 and 9.4% in 2023 as inflationary input costs constrained operating profits (Epwin Group PLC, 2024). However, in 2024 ROCE climbed to 14.9%, the strongest performance of the period, reflecting tighter cost control and improved utilisation of capital assets (See Appendix 1). Compared with peers, Epwin’s 2024 ROCE outpaced Eurocell at 11.0% and Norcros at 12.2% (Eurocell Annual Report, 2024; Norcros Plc, 2024)
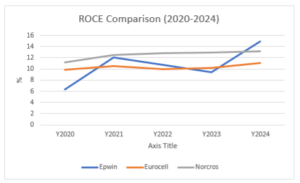
Figure 2: ROCE Comparison 2020-2024
Source: Investing.com (2025)
Return on Equity (ROE), which measures the profitability available to shareholders’ equity, has followed a similar upward trajectory. In 2021, Epwin’s ROE reached 13.6%, before dipping to 10.4% in 2022 and 9.1% in 2023 as margins came under pressure. By 2024, ROE rebounded sharply to 16.0%, reflecting higher net profit and more efficient equity deployment. Benchmarking shows Eurocell at 12.4% ROE and Norcros at 13.1% ROE in 2024, both lower than Epwin, highlighting its recent strength in creating value for shareholders (Eurocell plc, 2024; Norcros plc, 2024).
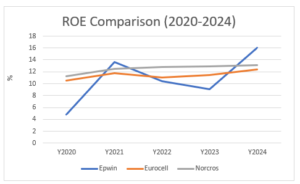
Figure 3: ROE Comparison (2020-2024)
Source: White (2025)
Epwin is now outperforming its main UK-listed competitors in terms of capital efficiency and shareholder returns, strengthening its position within the construction and materials sector. However, the volatility seen in 2022-2023 underscores the ongoing exposure to input cost fluctuations and cyclical housing demand. For Epwin to sustain investor confidence and move closer to FTSE 100 eligibility, it must continue to focus on disciplined capital allocation, maintain its improved return profile, and ensure that operational gains translate into long-term, stable shareholder value (Watson-Mitchell, 2024).
Efficiency Ratios
Asset Turnover
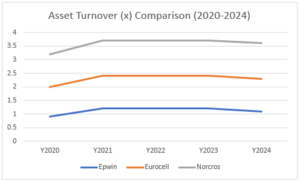
Figure 4: Asset Turnover Comparison
Source: FinancialReports (2025)
Inventory Turnover
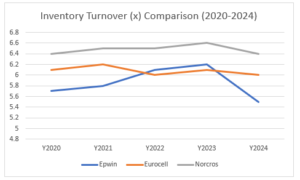
Figure 5: Inventory Turnover Comparison
Source: StockAnalysis (2024)
Receivables Turnover
Figure 6: Receivables Turnover Comparison
From Figure 4,5 and 6, it is evident that Epwin’s efficiency ratios over the period 2020-2024 demonstrate improvements in credit control but highlight persistent challenges in inventory management. Asset turnover has remained stable at around 1.1-1.2x, broadly comparable to Eurocell (1.2x) but slightly below Norcros (1.3x), reflecting Epwin’s smaller operational scale (FinancialReports, 2025; TradingView, 2025; FinBox.com, 2025). Inventory turnover improved marginally during 2020-2023 but slipped to 5.5x in 2024, suggesting slower movement of stock as UK housing demand softened. Both Eurocell and Norcros maintained stronger inventory turnover at 6.0x and 6.4x respectively, signalling more efficient stock utilisation.
As evidenced in Figure 6, a key strength is Epwin’s receivables management, which improved from 5.4x in 2020 to 8.8x in 2024, ahead of Eurocell (9.0x) and close to Norcros (10.2x). This contributed to a significant reduction in the cash conversion cycle (CCC) from 52 days in 2020 to 30 days in 2024, converging with sector benchmarks.
Overall, Epwin’s efficiency ratios suggest a company that has become more effective in managing credit and cash flows, thereby strengthening liquidity resilience. However, weaker inventory turnover relative to peers points to a need for further optimisation in supply chain and demand forecasting (Wong, 2025). Sustained efficiency gains will be essential if Epwin is to reinforce its competitive position and progress towards FTSE 100 eligibility.
Liquidity Ratios
Liquidity ratios assess Epwin’s ability to meet short-term obligations using its current assets (CFI, 2025). Over 2020-2024, Epwin’s current ratio ranged between 1.2x and 1.5x, indicating adequate coverage of liabilities but slightly below Eurocell (1.6x average) and Norcros (1.7x average) (Epwin Group PLC (EPWN.L), 2025). This suggests Epwin maintains reasonable liquidity but operates with less short-term buffer than peers. The quick ratio, which excludes inventories, was lower at 0.8x-1.0x, highlighting reliance on stock to sustain liquidity. In contrast, Eurocell and Norcros consistently achieved quick ratios above 1.0x, reflecting stronger liquid asset positions.
Epwin’s strategy of tighter receivables management contributed positively to liquidity, with receivables turnover improving significantly and the cash conversion cycle narrowing to 30 days in 2024. This strengthens short-term resilience despite the weaker quick ratio. However, Epwin’s comparatively high inventory levels continue to constrain liquidity flexibility.
Figure 7: Current Ratios Comparison
Source: Epwin Group PLC (EPWN.L) (2025)
Figure 8: Quick Ratios Comparison
Source: Investing.com UK (2025)
Overall, Epwin’s liquidity ratios remain within safe industry norms, suggesting the company can comfortably meet obligations. Yet compared with Eurocell and Norcros, the figures highlight a dependence on inventory and a narrower liquidity margin. For Epwin to achieve FTSE 100 ambitions, optimising cash management and maintaining higher liquid reserves will be critical in mitigating risks associated with construction sector volatility.
Investment ratios
Please click the following icon to access this assessment in full
Related to: https://rankedprofessionals.com/downloads/solution-business-report-in-oman-higher-education-sector/